Scientific reading · Methods and interpretation
Semaglutide risk measurements
How denominators, weighted percentages and overlapping outcomes shape a claim about a preparation.
AI-assisted editorial analysis; not medically reviewed. General education, not personal treatment advice. Publication disclosure.
A semaglutide risk percentage needs more than an ingredient name to make sense. It needs a defined outcome, a group of people, an observation rule and a method for combining their records. Changing any of those elements can change the question being answered. That matters when a clinical comparison appears beside a claim about a different preparation: a precise number can still be attached to the wrong question.
The digestive-outcome chart is a starting point for examining those connections. Its rows should be read separately, with attention to what each measurement includes. The discussion below develops the underlying mathematics and study-design reasoning through explicitly illustrative examples. It then asks what additional evidence would connect a clinical finding to another preparation. A clearer account of the measurement is more useful than treating a percentage as a property that follows a drug name everywhere.
Study context
- Define the group
- A denominator is a membership rule as well as a number. [1]
- Inspect the weighting
- Combining subgroup percentages can answer a different question from pooling their counts. [1]
- Separate classifications
- One event can be described along more than one dimension. [1]
- Preserve overlap
- Adding outcome groups requires knowing whether the same people appear in both. [1]
Digestive outcomes
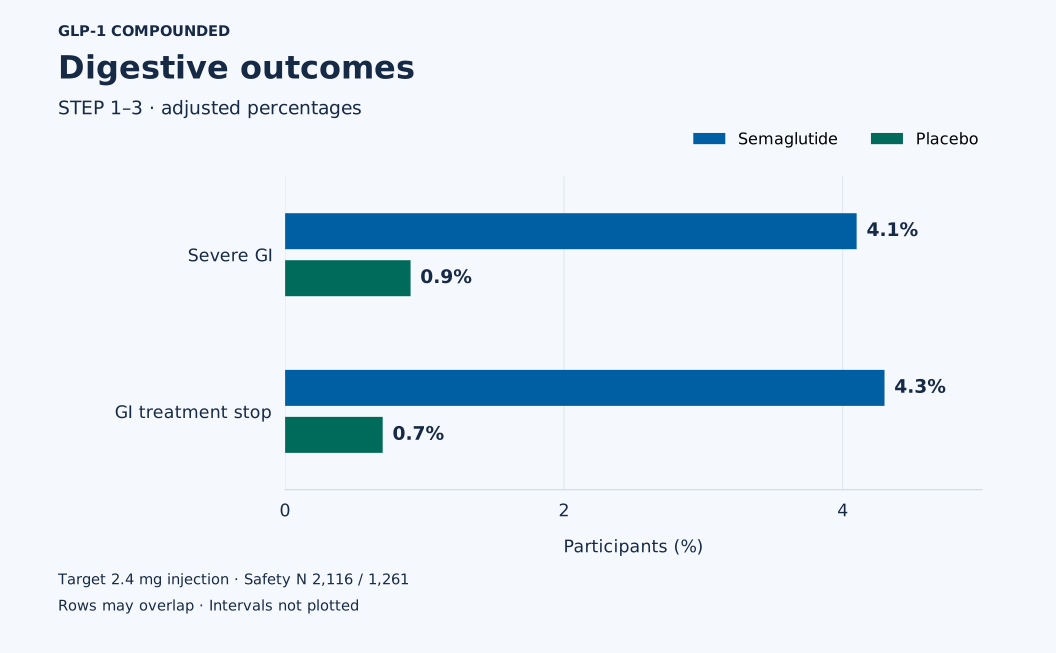
| Outcome | Semaglutide (%) | Placebo (%) |
|---|---|---|
| Severe GI | 4.1 | 0.9 |
| GI treatment stop | 4.3 | 0.7 |
Download: SVG figureCSV data
The preparation behind a percentage
Consider the structure of a claim that a preparation has a particular risk. The preparation is the object being described, but the percentage comes from observations on people. Connecting the two requires an argument: those people received a defined intervention under conditions relevant to the proposed use. A recognizable ingredient name identifies only part of that argument. It does not specify the complete comparison.
An illustrative research question makes the gap concrete. Suppose investigators wanted to compare preparation A with preparation B. They would first define the outcome and the people to whom the comparison should apply. They would then need a design that makes differences between groups interpretable. Comparing an outcome from A with an unrelated description of B leaves the central comparison unmeasured, even if both descriptions are accurate.
This is an evidence-matching problem, not a finding that either preparation is defective. Product identification, exposure and clinical outcomes are separate links in the reasoning. Evidence can strengthen one link without establishing the others. Our compounded-versus-brand guide provides background vocabulary for distinguishing those objects. Here, the scientific task is narrower: identify exactly which preparation and circumstances a numerical estimate describes before extending its meaning to a new setting.
Sources [1]
Who belongs in the denominator
Safety populations supply the denominators. To understand why that qualification matters, distinguish assignment, exposure and measurement. Assignment records a planned comparison; exposure records whether an intervention was received; measurement records what was observed. These are different properties of a participant record. A calculation needs a stated rule for deciding which records belong in it, rather than whichever total appears most prominently in an article.
For an illustrative membership exercise, imagine a roster with separate columns for invitation, attendance and completion of a questionnaire. The invitation list answers how many people were approached. Attendance answers how many arrived. Completed questionnaires answer how many supplied that measurement. Dividing questionnaire responses by invitations instead of completed questionnaires changes the meaning of the fraction. Neither label is interchangeable with the other simply because both refer to the same project.
Clinical analysis sets require the same care, although their eligibility rules are more specific than this example. The important check is whether the numerator and denominator describe compatible records. An outcome count from one set cannot be paired casually with a total from another. The semaglutide guide offers broader drug background; identifying an analysis set remains a separate task whenever a particular study estimate is quoted.
Sources [1]
Why weighting changes a percentage
Percentages are adjusted. Weighting can be understood as a decision about how much each subgroup contributes to a combined result. A subgroup is sometimes called a stratum. The combined percentage depends both on the percentages within those strata and on their assigned contributions. Raw pooling instead gives each individual record equal influence, so a larger stratum contributes more records to the final fraction.
Consider an entirely hypothetical, nonclinical example. A small library branch returns 2 of 10 requested books late; a large branch returns 9 of 90 late. Pooling the records gives 11 late returns out of 100, or 11%. Giving the two branch percentages equal weight gives the average of 20% and 10%, or 15%. The records have not changed. The summary changed because the branches contributed differently.
Equal branch weighting is only an illustration, not a reconstruction of clinical weights. It shows why multiplying an adjusted percentage by a pooled population need not recover an observed count. To reproduce a published adjustment, an analyst would need its actual method and the appropriate inputs. A discrepancy with simple division is therefore a reason to inspect the method, rather than silently replacing the reported estimate with a different statistic.
Sources [1]
The observation rule changes the question
A person can satisfy an analysis-set definition while only some of that person’s observations qualify for a particular calculation. Membership and observation eligibility are therefore separate decisions. An analysis might address experience during a specified exposure window; another might address experience after assignment regardless of later exposure. Those questions can use overlapping records while describing different periods of a participant’s history.
Imagine an illustrative study diary with entries before, during and after an intervention. Drawing a boundary around selected dates does not erase the other entries. It defines which entries answer the chosen question. If an event sits outside that boundary, its absence from a calculation cannot be interpreted as evidence that the event never happened. Conversely, including it in another analysis does not make the first analysis arithmetically wrong.
The methodological issue is whether the boundary matches the claim. A statement about an entire course of care needs a different justification from a statement restricted to an exposure window. Reasons that observations become unavailable also matter, because missing records may differ from retained records. The companion article on tirzepatide trial windows explores treatment history and observation periods. Its design questions help sharpen reading without creating a comparison between drugs.
Intensity and seriousness
Intensity describes how strongly an event manifests; seriousness applies a separate classification concerned with its consequences under specified criteria. Treat these as two fields in a record, each with its own definition. A label in the intensity field does not fill in the seriousness field. A valid summary must preserve that distinction rather than turning familiar everyday words into interchangeable technical categories.
A useful conceptual exercise is to draw a grid. Put intensity categories along one axis and seriousness categories along the other. Each event would occupy a position determined by both classifications. Knowing the total along one axis does not reveal how that total is distributed along the other. Recovering the cross-classification would require joint information, not a more forceful interpretation of the word severe.
The same logic prevents a broad adjective such as tolerable from replacing a defined endpoint. A reader may care about intensity, consequences, recurrence and the burden of treatment, but those concerns need distinct measurements. Combining them into a reassuring or alarming label conceals which dimension was actually measured. For general clinical context, see the side-effects guide. The measurement lesson here is to retain the original outcome definition whenever a numerical result moves into a headline or comparison.
Sources [1]
When outcome groups overlap
A percentage of people and a count of events are different units. Someone can contribute multiple events while remaining one person in a participant-level outcome group. Someone can also belong to multiple outcome groups. Before combining results, identify whether the rows describe mutually exclusive categories, overlapping sets of people or repeated observations. Similar formatting does not establish that the underlying units are compatible.
For an illustrative set exercise, imagine a survey asking who borrowed a printed book and who borrowed an audiobook. Some respondents may have done both. Adding the two group sizes counts those respondents twice. To calculate the number who did either, the overlap must be known and counted only once. Separate totals alone do not identify that overlap, regardless of how precisely the totals were measured.
A treatment decision introduces another distinction: an outcome describing an event and an outcome describing a decision need not identify identical groups. A decision can depend on information beyond one classification field. Consequently, the relative sizes of two outcome groups cannot reveal the path each person followed. Participant-level links between events and decisions would be needed to study that path. The appropriate reading of separate rows is therefore separate answers to separate questions, with shared membership left unresolved unless measured.
Sources [1]
What a single number compresses
A participant percentage compresses a collection of records into one summary. That compression is useful for comparison, but it discards information about how experiences are distributed among individuals. A group could contain a concentration of repeated events or a broader spread of isolated events. A participant-level summary alone cannot distinguish those patterns. Additional summaries would need to be chosen according to the question being investigated.
Point estimates also leave sampling uncertainty unresolved unless an appropriate uncertainty measure accompanies them. No uncertainty interval is plotted here. That display choice is not evidence that uncertainty is absent, small or equal between groups. Nor can precision be reconstructed simply by counting decimal places. The appearance of a chart and the information available for statistical inference are different things.
The table separates three types of summary that are easy to confuse. Each preserves one aspect of the observations while omitting others. More detail does not automatically improve an explanation: the useful addition is the detail that answers the next question. For example, studying recurrence calls for information about repeated events, whereas studying observation coverage calls for time information. One cannot be substituted for the other just because both make a dataset look more complete.
| Statistic | What it summarizes | What it does not show |
|---|---|---|
| Weighted participant proportion | Outcome membership combined under a weighting rule | An observed event count or each person’s experience |
| Repeated-event count | Recorded occurrences, including possible repeats | The number of distinct people without linked records |
| Follow-up time | The span or accumulated amount of observation | Outcome intensity or a preparation’s quality |
Sources [1]
Connecting a result to another preparation
Transferring evidence means deciding whether an inference remains justified in a new setting. It requires specifying what changed. A change in preparation, route, population, exposure or outcome definition creates a different question about comparability. Merely listing similarities does not establish that the remaining differences are irrelevant. Equally, identifying a difference does not by itself quantify its clinical effect. Both conclusions require an evidentiary bridge.
The table maps several possible claims to the kinds of information that would address them. It is a conceptual research map, not a laboratory specification or a declaration that any provider has met a standard. A quality description and a clinical outcome comparison have different objects. Even a detailed answer to the first cannot automatically supply the missing observations needed for the second.
For added ingredients, the corresponding research question is whether changing the preparation changes a defined outcome under comparable conditions. The guide to semaglutide with added B12 is relevant background for recognizing that separate claim. Inferring benefit from the presence of an additional ingredient would skip the outcome comparison. Inferring harm merely from its addition would skip it too. A defensible conclusion should identify the evidence available for that particular change and leave unmeasured effects unquantified.
| Question | Relevant evidence | Remaining gap |
|---|---|---|
| Are clinical outcomes comparable? | Comparable outcomes measured in relevant groups | An ingredient description alone supplies no outcome comparison |
| Is exposure comparable? | Evidence connecting preparation, route and exposure | A matching ingredient name does not measure exposure |
| What does preparation quality mean here? | A defined quality claim and evidence addressing it | Clinical percentages do not establish every quality attribute |
| Does an added ingredient change outcomes? | A comparison that isolates the proposed change | Its presence alone does not quantify benefit or harm |
Current clinical context
WEGOVY’s label warns about severe gastrointestinal reactions and acute kidney injury associated with volume depletion; it does not recommend use in severe gastroparesis. ZEPBOUND’s label carries corresponding warnings and likewise does not recommend use in severe gastroparesis. These brief statements provide clinical context, not a complete prescribing summary. Their role differs from a historical comparison designed around a particular set of observations.
FDA states that unapproved GLP-1 versions lack its premarketing review for safety, effectiveness and quality. This regulatory boundary and the statistical interpretation address different questions. One concerns the review status of a product; the other concerns what an estimate measures. A clinical percentage cannot substitute for a product’s review history, and a statement about review status cannot supply a missing numerical outcome comparison.
Keeping those questions separate makes the reasoning testable. A claim about clinical outcomes should identify its outcome evidence. A claim about approval should identify the relevant regulatory basis. A claim about suitability for an individual requires clinical assessment beyond a group summary. The legal-status guide is a separate reference for regulatory context. None of these categories turns a chart into a treatment protocol, a judgment about a named provider, or a prediction of one reader’s experience.
A claim matched to its evidence
Novo Nordisk funded the trials and writing assistance; company employment, shareholding and other industry relationships were disclosed. Funding belongs in the evidence description because readers should know who supported the work and which relationships were reported. That disclosure does not calculate a correction factor for an estimate. Evaluating the numerical claim still requires inspection of definitions, analysis choices and the connection between the result and its interpretation.
A compact reading audit can follow one claim through four questions. What outcome is counted? Who qualifies for the denominator? Which observations qualify over time? Which preparation and setting does the evidence describe? Write the answers in full before shortening the claim. If the shortened version loses a condition necessary to interpret the number, the wording has become broader than the evidence it is meant to summarize.
Commercial documents are another object to inspect. As an editorial application, readers examining written terms can use the CoreAge Rx review or Henry Meds review as starting points for document checks. Neither link establishes an outcome, product identity or clinical equivalence. The useful discipline is traceability: a statement about a service should lead to the relevant service document, while a scientific claim should lead to evidence that actually measures it.
Sources [1]
Questions
Why can a reported percentage differ from raw division?
Raw division pools records according to their numbers. A weighted calculation assigns contributions according to an additional rule, which may operate across study groups. The two calculations need not answer the same question. Reproducing a weighted result requires its method and inputs; multiplying a rounded percentage by a pooled total is not a substitute for that reconstruction. [1]
Does severe mean the same as serious?
No. Read intensity and seriousness as separate classification fields. Knowing one field does not determine the other, just as knowing a row total in a grid does not reveal every cell. A claim about their relationship would need joint classifications. Neither term should be replaced with a broad claim that all relevant experiences were acceptable or unacceptable. [1]
Can the two chart rows be added?
An addition would need compatible units and evidence that shared membership has been handled. Otherwise, one person could be counted in both groups. Even knowing both separate totals would not reveal which people appeared twice. A combined outcome requires its own definition and calculation; the visual proximity of two rows supplies neither. [1]
Does a trial percentage describe every preparation with the same ingredient?
An ingredient name does not supply the comparison needed to establish that extension. The proposed claim should specify the preparation, route, population, exposure and outcome. Evidence can then be assessed against those features. Where the connection has not been established, the scientific conclusion is that the extension remains unmeasured, rather than a numerical prediction in either direction. [1][5]
Why keep prescribing information separate from a trial estimate?
They serve different interpretive roles. A study estimate answers a defined research question; prescribing information supplies product-specific clinical context. Combining their purposes can turn a historical group result into an apparent instruction for an individual. Read each for the question it addresses, preserve the product and formulation distinctions, and do not treat a short article as complete prescribing information. [3][4]
Editorial assessment
The strongest reading of a risk comparison preserves its measurement rules. Identify the counted outcome, match the denominator to its analysis set, inspect weighting and time eligibility, and keep overlapping groups separate. Those steps explain what the number can support before any claim is extended to a new preparation. Evidence transfer then becomes a concrete research problem: which proposed similarity has been demonstrated, and which connection still needs measurement? A transparent account can be useful even when it leaves that last question open. Precision in wording should reflect precision in evidence, rather than make an unmeasured comparison sound settled.
Evidence limits
This interpretation uses the full primary articles and their supplements, including funding and conflict disclosures, plus current official labeling and FDA material. Individual participant records and complete trial protocols were not reviewed. Worked counting examples and conceptual tables are editorial explanations, not observed clinical results. The figure displays point estimates without uncertainty intervals. This article does not establish equivalence between preparations or provide individual prescribing advice.
Sources
Research access: full articles and supplements. Official labels and FDA guidance were also checked. Individual participant records and complete trial protocols were not reviewed. Checked dates use UTC.
- Wharton et al. 2022Checked .
- Rubino et al. 2025Checked .
- DailyMed: Wegovy prescribing informationChecked .
- DailyMed: Zepbound prescribing informationChecked .
- FDA: Unapproved GLP-1 drugsChecked .